MICHIGAN PREVENTION DATA ATLAS
PREVENTION AT THE INTERSECTIONS
14 Live Data Feeds · 63 Measures · 83 Counties · 2026
Prevention At The Intersections

Where structural
harm becomes
visible.

28 SDOH indicators across all 83 Michigan counties in 8 categories — now with MDHHS Senate and House legislative district data embedded per county. Select counties, generate print-ready reports, and cite with full APA references.

28
SDOH indicators
63
Measures
83
Michigan counties
8
Domain categories
38
Senate districts
via MDHHS
110
House districts
via MDHHS
The Measures

28 SDOH Indicators

Every indicator below carries its unit, a plain-language description, and its data source. All 28 flow through the iRISE™ eight-domain engine, the County Map, the Report Builder, and the Solution Forge — ranked across all 83 Michigan counties.

County Map

Michigan and its 83 counties, in true shape. Select any indicator to shade the map by county-level burden — live values where feeds allow — then click counties to build a side-by-side comparison.

Click counties to add them to a side-by-side comparison (up to 5).
Burden Heaviest High Moderate Lower Lightest

How to Use the Atlas

Four ways to turn the atlas into actionable intelligence for your organization.

D1
Economic Security & Poverty

The material foundation of household life: income adequacy, employment, poverty, public benefit participation, and housing cost burden. Economic insecurity conditions every other domain.

D2
Housing Stability & Quality

Whether residents can stay housed, and whether that housing is safe: eviction, overcrowding, substandard and aging housing stock, homelessness, and homeownership access.

D3
Health Access & Outcomes

Coverage, care access, and the outcomes they produce: uninsured rates, preventable hospitalization, life expectancy, infant and maternal mortality, and primary and behavioral care access.

D4
Education & Opportunity

The infrastructure of opportunity across the life course: early literacy, graduation, childcare access, post-secondary enrollment, and the broadband and transportation that make each reachable.

D5
Safety & Violence

Exposure to violence and to the systems that respond to it: violent crime, domestic violence, community safety perception, juvenile justice involvement, and incarceration.

D6
Environmental Conditions

The physical environment as a determinant of health: air quality, lead exposure, food access, park access, and proximity to toxic and brownfield sites.

D7
Social Capital & Cohesion

The connective tissue of community: civic participation, nonprofit density, voter registration, association membership, social connection, and trust.

D8
Racial & Structural Equity

The structural distribution of burden itself: residential segregation, racial income gaps, disparate impact across systems, and historical disinvestment — the domain that explains why the other seven concentrate where they do.

A working path through the Atlas

1
Start with the data →

Read the 28 indicators with their definitions and sources. Note which ones name the problem you are working on — those are your search terms for everything that follows.

2
See where it concentrates →

Pick an indicator from the dropdown to shade all 83 counties by burden (live values where feeds allow). Click up to five counties to compare them side by side, then use the gold button to carry them into a report.

3
Build the evidence →

Select counties (or a region), indicators, and a report type — CHNA, Grant, Board, or Policy. Write your intersectional narrative, check the district and BRFSS bonuses, and Generate: a print-ready document with live data, burden levels, evidence-based solutions, and full citations.

4
Go from data to solutions →

Either click Send This Data to the Solution Forge inside the Report Builder (your counties and narrative carry over, weights pre-set from measured burden), or work the four Forge steps fresh. Finish with the iRISE™ Intersections Report.

5
Understand the framework → &

The Framework page maps indicators to the eight domains; the Glossary defines all 35 working terms — κ, SIEP, burden levels, the Phase 1 co-design gate — so every reader of your report shares the vocabulary.

6
Cite everything →

Full APA 7th edition references for every data source. Generated reports carry their citations automatically; use this page when excerpting figures into your own documents, testimony, or media materials.

8 Categories · 28 Indicators · 63 Measures

All 28 indicators are mapped to the Healthy People 2030 Social Determinants of Health domains. This framework is the entry point for CHIP planning, Prevention Agenda alignment, and cross-sector coordination.

Neuro-Equity

Lead Burden, ACE Rate, TBI Rate, SUD Prevalence

Child & Family

NOWS, CPS, Infant Mortality, Child Poverty

Environmental

Superfund Sites, Lead Exposure, Air Quality

Justice

Juvenile Justice, Adult Incarceration

Aging & Cognitive

Dementia, Senior Isolation, Medicare Cognitive Assessment

Economic & Community

ALICE, Uninsured, Broadband Access

Maternal & Youth Health

Maternal Mortality, Preterm Birth, 988 Crisis Calls, Youth Sadness

Environmental Justice

Segregation, Food Insecurity, Unhoused, Heat Island, Brownfield, Transportation

Glossary

Plain-language definitions for all key terms used in the Michigan Prevention Data Atlas.

iRISE™

Intersectional Resilience Index for Social Equity. A prioritization framework — not a data feed — that reads county data through eight domains, directs attention to where burden stacks across multiple domains at once, and generates ranked, evidence-based intervention pathways. Authored by Dr. Crystallee Crain.

Solution Forge

The guided four-step instrument that operationalizes iRISE™: name the problem and place, map the intersections, weigh the burdens (κ), and forge the pathways — finishing in a copy-ready solution brief with citations. Runs entirely in the browser.

Report Builder

The Atlas tool that generates print-ready county reports — CHNA, Grant Application, Board Presentation, and Policy Brief formats — with live data feeds, embedded MDHHS district dashboards, storytelling, and full APA references.

κ (Compounding Coefficient)

The mathematical expression of intersectionality in iRISE™: when two or more domains exceed the 75th-percentile burden threshold, κ rises above 1, quantifying that co-occurring burdens amplify rather than add (grounded in Crenshaw, 1989).

Eight-Domain Framework

iRISE™'s organizing structure: D1 Economic Security & Poverty, D2 Housing Stability & Quality, D3 Health Access & Outcomes, D4 Education & Opportunity, D5 Safety & Violence, D6 Environmental Conditions, D7 Social Capital & Cohesion, D8 Racial & Structural Equity.

Intersectionality

The analytic framework, originated by Kimberlé Crenshaw, holding that overlapping identities and systems — race, class, gender, place, health — produce compounding experiences of burden that single-axis analysis cannot see.

Single-Axis Intervention

A program designed around one indicator or one identity at a time. The intersectionality literature documents that single-axis interventions can worsen inequities for the most-burdened subgroups (Tinner et al., 2023).

SIEP Escalation

The multilevel escalation path in iRISE™: when burden is high, the framework forces organizational- and structural-level pathways rather than allowing individual-level responses to stand alone — the solution must match the scale of the problem (Faraji et al., 2021).

Pathway (Individual / Organizational / Structural)

The three levels at which every iRISE™ evidence-based solution is expressed: direct supports to households, redesign of institutions and delivery systems, and change to laws, financing, and structures.

Evidence-Based Solution

An intervention pathway whose description carries a citation to the peer-reviewed intersectionality and multilevel-intervention literature — the standard for every pathway the Forge and Report Builder generate.

Community Co-Design Gate (Phase 1)

The iRISE™ requirement, within Phase 1, that the affected community be co-designing the work before pathways are marked implementation-ready; without it, generated pathways are flagged provisional (Collins, 2019).

Community Co-Design

Shared authorship of problem definition, priorities, and solutions between institutions and the community carrying the burden — community knowledge enters the iRISE™ math through the domain weights.

Domain Weight

A 0–100 value assigned to each of the eight domains in the Forge, ideally set with the affected community. Weights determine which counties surface in the burden ranking and which pathways lead the brief.

Burden Level

The Atlas classification of a county's rank on an indicator among all 83 Michigan counties: High Burden (1–20), Elevated (21–45), Moderate (46–65), Lower Burden (66–83).

Composite Burden Score

A 0–100 summary of a county's overall position across measured indicators; in the Forge, the iRISE™ score is the weighted mean of domain burdens multiplied by the county-level κ.

Percentile Rank

A county's position among all 83 Michigan counties on an indicator, where rank 1 carries the heaviest burden; the basis for burden levels and domain scores.

Multi-Level Geographic Analysis

Reading burden at three levels together — county (foundational unit), legislative district (MDHHS Senate and House dashboards), and state (Michigan benchmarks) — as every generated report does.

Live Data Feed

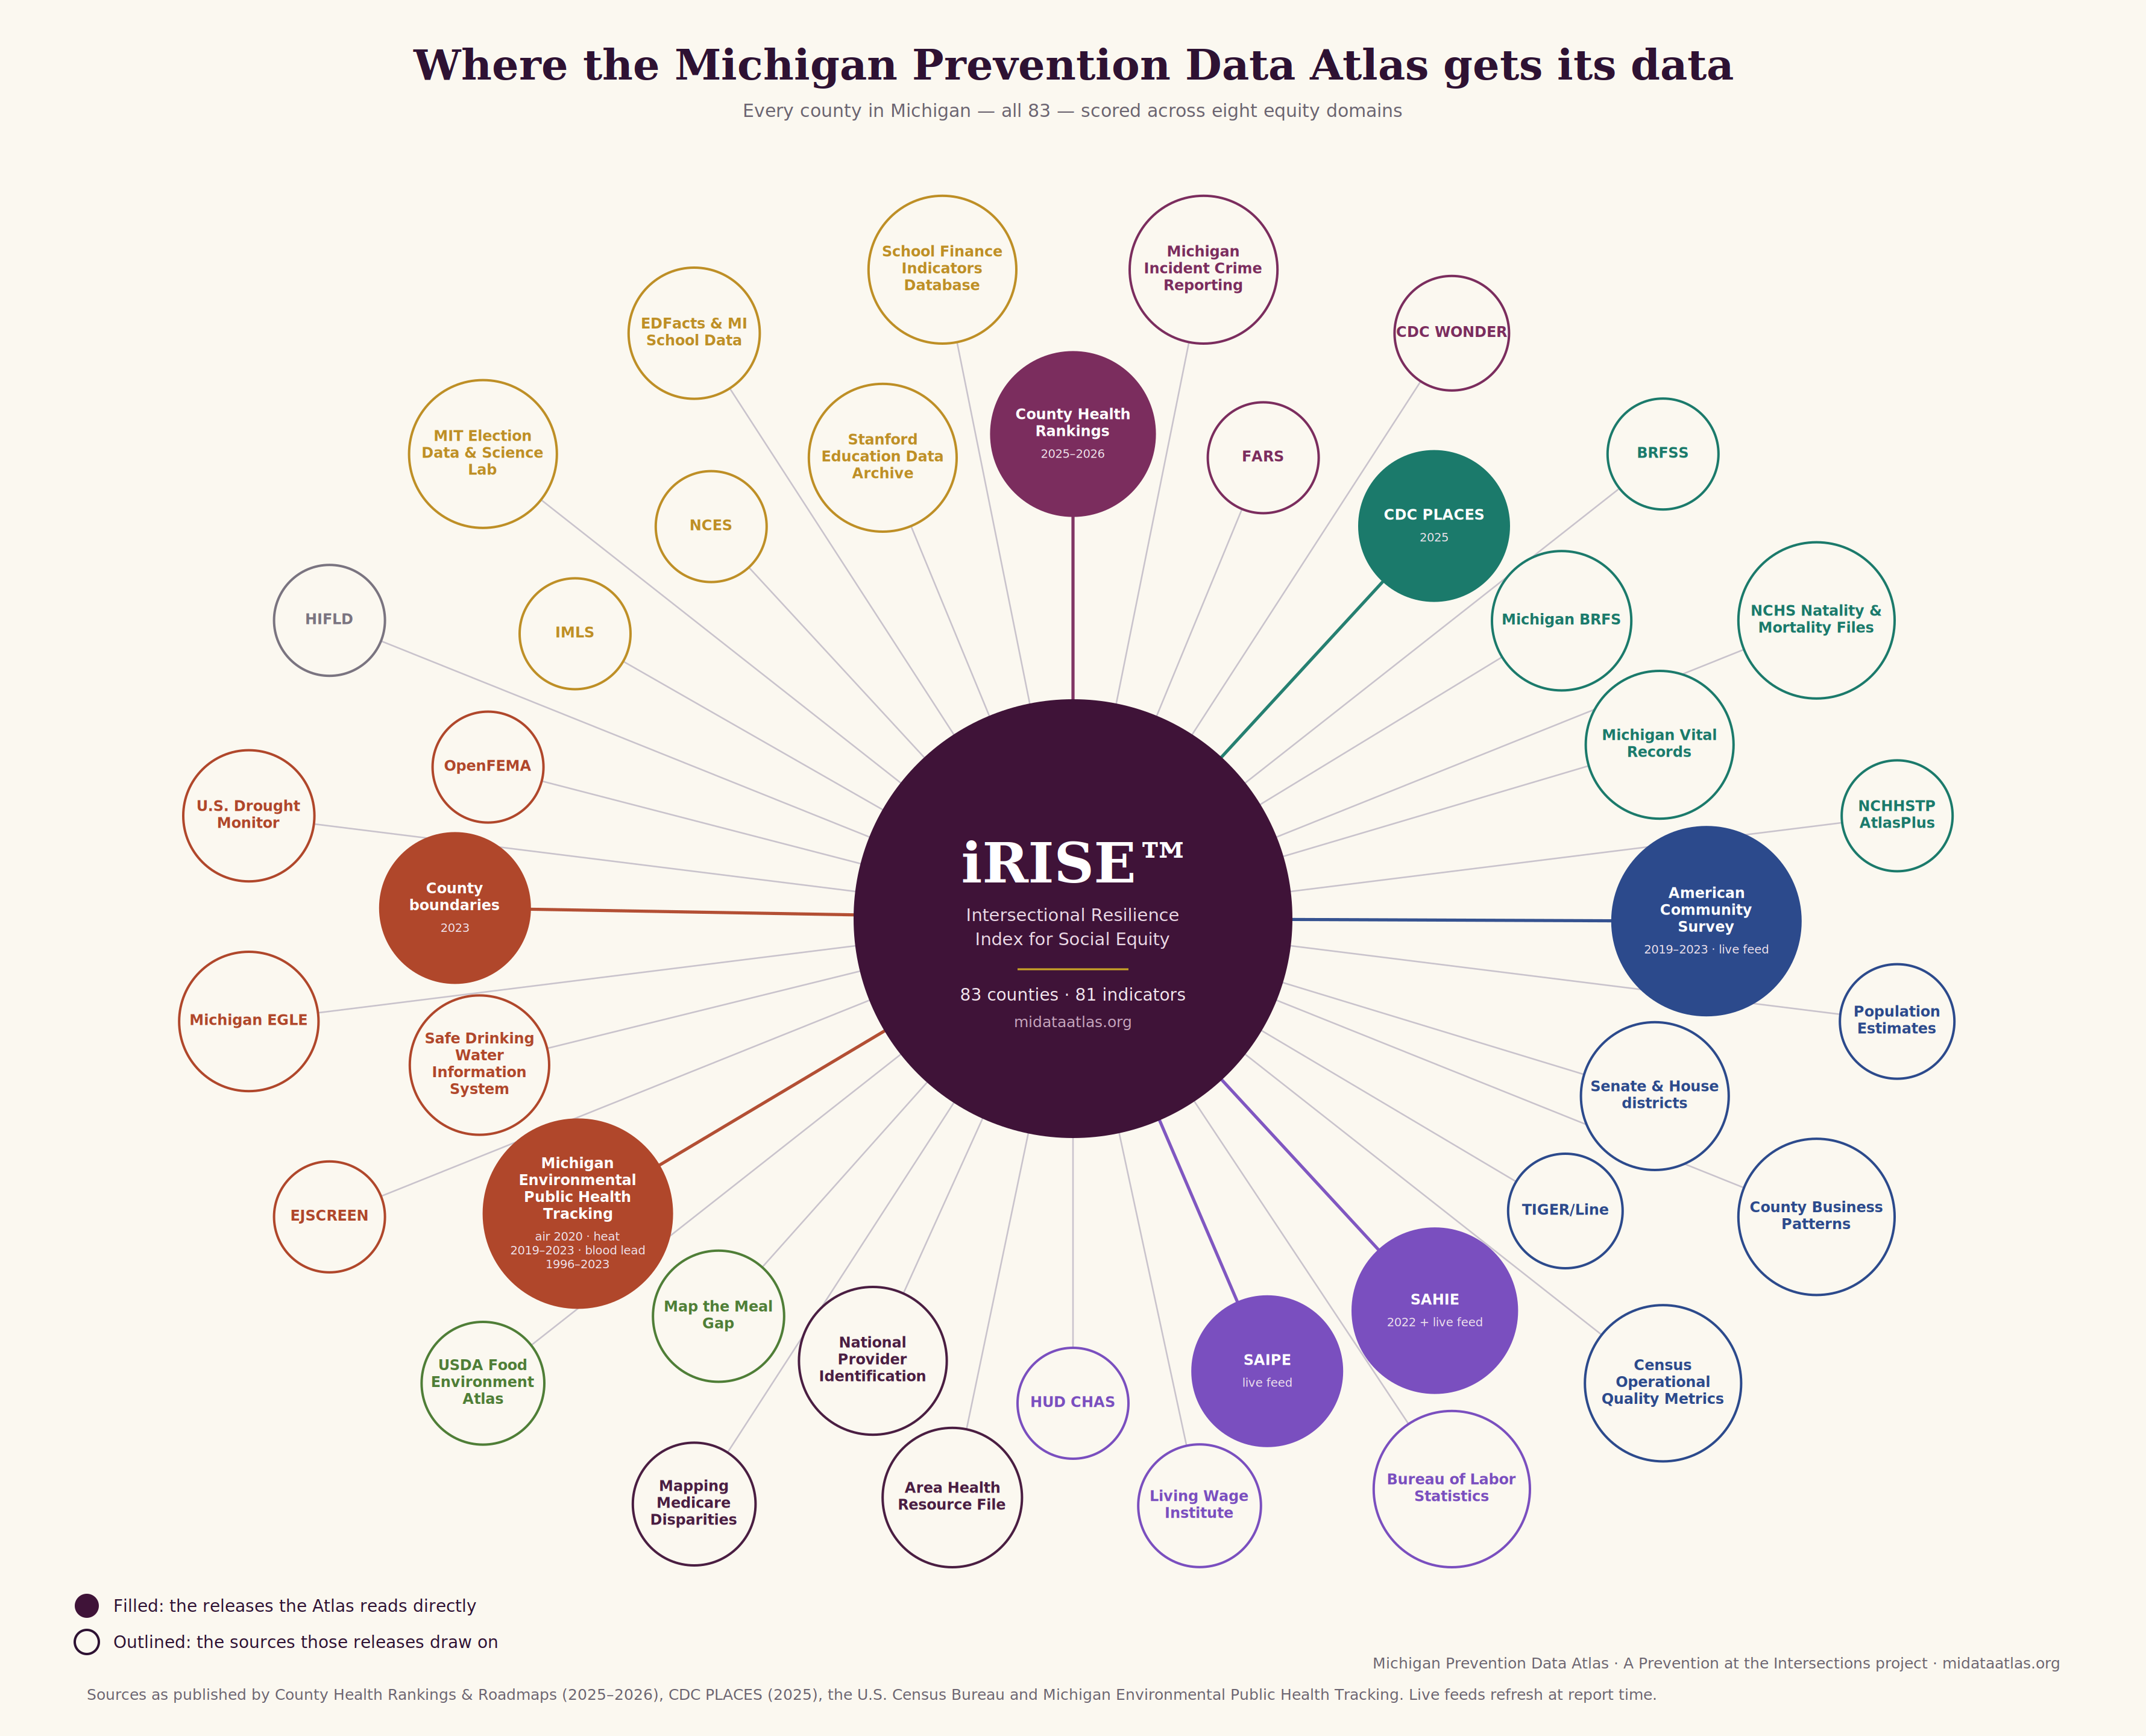
A value fetched in the browser at report time from the publishing agency's open API — CDC PLACES, Census SAIPE, SAHIE, ACS, and EPA FRS — marked LIVE in reports and ranked across all 83 counties from the same live pull.

Model-Based Estimate

A statistically modeled value (such as CDC PLACES small-area estimates) rather than a direct count; the Atlas labels these distinctly from live administrative figures.

SDOH (Social Determinants of Health)

The conditions in which people are born, live, learn, work, and age — the non-clinical drivers of health outcomes that the Atlas measures across its 28 indicators.

Healthy People 2030

The federal framework of national health objectives whose SDOH structure the iRISE™ eight domains align with.

CHNA

Community Health Needs Assessment — the evaluation nonprofit hospitals must conduct under IRS 501(r)(3); the Report Builder generates the four-step CHNA format.

CHIP

Community Health Improvement Plan — the action plan public health agencies build from assessment findings; Atlas county data serves as its quantitative baseline.

ACE (Adverse Childhood Experience)

Potentially traumatic events before age 18 — abuse, neglect, household disruption — whose accumulation predicts lifelong health and social risk (CDC-Kaiser ACE Study).

ALICE

Asset Limited, Income Constrained, Employed — United Way's measure of households earning above the poverty line but below a basic survival budget.

BRFSS

Behavioral Risk Factor Surveillance System — the CDC's national telephone survey of adult health behaviors, chronic conditions, and preventive service use; the basis for the Atlas's Adult Community Health Profile.

CDC PLACES

The CDC's model-based small-area estimates program publishing county-level prevalence for dozens of BRFSS measures; one of the Atlas's live feeds.

SAIPE / SAHIE

The Census Bureau's Small Area Income and Poverty Estimates and Small Area Health Insurance Estimates programs — the Atlas's live sources for child poverty and uninsured rates.

NOWS

Neonatal Opioid Withdrawal Syndrome — withdrawal experienced by newborns exposed to opioids in utero, measured per 1,000 live births.

Dissimilarity Index

A 0–100 measure of residential segregation indicating the share of one group that would need to relocate for even distribution; the Atlas's D8 segregation measure.

Point-in-Time (PIT) Count

HUD's annual single-night census of people experiencing homelessness; the Atlas's unhoused population source.

Weathering

The hypothesis (Geronimus) that chronic exposure to social and economic adversity accelerates physiological aging in marginalized populations — encoded by the Forge as a measurable framing in maternal health cases.

Matrix of Domination

Patricia Hill Collins's framework describing how intersecting systems of power organize experience across structural, disciplinary, hegemonic, and interpersonal domains — the grounding of iRISE™'s structural-systems checklist.

Disparate Impact

When a facially neutral policy or practice produces disproportionate harm to a protected group — measured in D8 and audited in iRISE™'s fairness audit (Himmelreich et al., 2024).

Intersectional Fairness Audit

The iRISE™ phase testing whether generated priorities and pathways hold up when results are disaggregated across intersectional subgroups rather than averaged (Wang et al., 2022).

Data Sources & Citations

APA 7th Edition References

All 28 indicators are sourced from publicly available federal and state datasets. Full citations below are formatted for direct use in CHNAs, grant applications, academic papers, and policy briefs.

How to cite: Prevention at the Intersections. (2026). Michigan Prevention Data Atlas [Data tool]. Prevention At The Intersections. https://midataatlas.org — Include indicator name, county, and retrieval date when citing individual data points.
Custom County Profiles

Report Builder

Select counties and indicators, choose your report purpose, then click Generate. All 83 Michigan counties and all 28 indicators are available. MDHHS Senate and House district data is included.

① Select Counties ② Select Indicators ③ Generate Report
01

Click counties above to add them to your report

02
All 28 indicators are included by default ▾ — open to customize the selection
03
Board of Directors focus — problems the board is trying to solve (applies to Board Presentation reports)
The Intersectional Narrative — embedded in your generated report
Narrative frames to weave in:

Second path to solutions: your selected counties, indicators, and story carry into the Forge automatically — domain weights set from your counties’ measured burden, ready to score and forge.

Opens in a new window and fetches live county data from CDC PLACES, U.S. Census (SAIPE · SAHIE · ACS), and U.S. EPA at report time — values marked LIVE are real figures, not estimates. Print / Save as PDF with Ctrl+P. Source: Michigan Prevention Data Atlas · Prevention at the Intersections · preventionagenda.org

Selected Counties 0 selected

Select counties to preview report scope.

BONUS Senate District Health Profile 0 of 38

Michigan’s Senate community-health dashboard publishes six measures by state Senate district — life expectancy, opioid overdose deaths, early prenatal care, childhood lead exposure, rent burden, and MMR vaccination. Source: MDHHS Division for Vital Records & Health Statistics.

Official MDHHS Tableau dashboard — also embedded live below
Loading the MDHHS Senate Legislative District Public Health Dashboard…
BONUS House District Health Profile 0 of 110

Michigan’s House community-health dashboard publishes the same public health metrics by state House district — covering all 110 districts. Includes health outcomes, behavior trends, social/economic factors, physical environment, and clinical care access. Source: MDHHS Division for Vital Records & Health Statistics.

Official MDHHS Tableau dashboard — also embedded live below
Loading the MDHHS House Legislative District Public Health Dashboard…
BONUS Adult Community Health Profile (BRFSS)

The Behavioral Risk Factor Surveillance System (BRFSS) is the nation’s premier system of health-related telephone surveys. This profile uses BRFSS and CDC PLACES model-based county estimates for adult health behaviors, chronic conditions, preventive services, and disability status across Michigan. Select counties above and the generated report will include the full CDC PLACES table of real, live-fetched estimates for each county — smoking, binge drinking, physical inactivity, obesity, diabetes, COPD, heart disease, depression, high blood pressure, mental distress, checkups, dental visits, cancer screenings, insurance coverage, social isolation, and food insecurity.

Health Behaviors

Current smoking, binge drinking, physical inactivity, obesity, sleep <7 hours, no leisure-time physical activity

Chronic Conditions

Arthritis, asthma, cancer, COPD, coronary heart disease, diabetes, high blood pressure, high cholesterol, kidney disease, stroke, depression

Prevention & Access

Annual checkup, dental visit, cholesterol screening, colorectal cancer screening, mammography, core preventive services for older adults, health insurance coverage

Live County Profile: Compare with:
Source: CDC PLACES / BRFSS model-based estimates

Built for Six Sectors

The atlas serves government agencies, health systems, nonprofits, funders, researchers, and community advocates.

Government Agencies & Public Health Officials

State, county, and municipal agencies responsible for Community Health Improvement Plans, budget justification, and program targeting. The Atlas provides multi-level geographic analysis — county values ranked statewide, MDHHS Senate and House legislative district dashboards, and Michigan benchmarks in one instrument — enabling agencies to align county-level programming with district-level advocacy and state-level policy, with every figure carrying a full APA citation suitable for the public record.

Hospital & Health System Planners

Nonprofit hospitals subject to IRS 501(r)(3) Community Health Needs Assessment requirements. The Report Builder generates CHNA-formatted profiles following the four-step framework — community definition, quantitative data collection, prioritization, and implementation planning — with live CDC PLACES, Census, and EPA values, composite burden scores, and the BRFSS Adult Community Health Profile embedded per county.

Researchers & Academic Institutions

Investigators in public health, social work, sociology, and health equity requiring transparent, replicable county-level measures. The Atlas documents each indicator's source, year, and unit; distinguishes live API-fetched values from model-based estimates; and grounds its intersectional method in the peer-reviewed literature catalogued in the iRISE™ Scholarly Foundation — supporting citation in manuscripts, grant applications, and IRB protocols.

Nonprofit & Community-Based Organizations

Direct service and advocacy organizations building needs statements, program designs, and evaluation baselines. The Grant Application report type generates a five-part needs statement with real county figures; the Solution Forge translates measured burden into individual, organizational, and structural pathways the organization can carry into strategic plans and funder conversations.

Funders & Philanthropy

Foundations, donor-advised funds, and corporate giving programs allocating resources across Michigan geographies. The iRISE™ county scoring and burden rankings support portfolio targeting where layered, cross-domain burden is heaviest, while the eight-domain framework offers a shared vocabulary for grantee reporting and cross-portfolio comparison rooted in equity rather than population size alone.

Community Advocates & Residents

The people closest to the burden and to its solutions. Every tool on this site runs in the browser at no cost, requires no data science training, and produces print-ready documents residents can carry into county commissions, school boards, and legislative offices — because the Phase 1 co-design gate of iRISE™ holds that pathways are only implementation-ready when the affected community is at the table.

Single-axis solutions fail at the intersections.
Build ones that don’t.

The Solution Forge turns the same iRISE™ engine behind this Atlas into a guided tool. Name a social problem, map the intersecting identities and systems, weigh the burdens, and the Forge generates ranked intervention pathways — escalated across individual, organizational, and structural levels, with citations. No data science required.

κ COMPOUNDED RACE CLASS PLACE GENDER HEALTH

Forge a solution

Work through the four steps. Everything runs in your browser — nothing is sent anywhere. You’ll finish with a copy-ready solution brief: ranked pathways and citations.

① Problem & Place
② Intersections
③ Burdens · κ
④ Pathways
Step 1 of 4 · Phase 1 — Community Context · Name the problem and the place

iRISE™ begins by locating the problem in a specific Michigan community. Be concrete — select the counties where the burden lives; they frame the problem in context and carry into the county scoring.

The Social Problem — what is happening, and to whom? One or two sentences.
Location / State
Select counties
Community most affected (optional)
Community Co-Design — part of Phase 1: how is the affected community at the table?
Step 2 of 4 · Map the intersections

Who carries this burden where systems overlap? Name the intersecting identity axes, then the populations at their center — the questions force the analysis past one wound at a time toward the compounding cause.

Intersecting identity axes
Populations at the intersection
Step 3 of 4 · Burdens · κ — weigh the domains, score the counties

Community knowledge enters the math here. Weight each of the eight iRISE™ domains (D1–D8) 0–100. When two or more domains exceed the 75th-percentile threshold, the compounding coefficient κ rises above 1 — the mathematical expression of intersectionality: co-occurring burdens amplify each other.

Key: how to weight the domains on a particular issue

The scale: 0–25 = background (present but not driving this issue) · 26–50 = contributing (shapes the issue indirectly) · 51–75 = significant (a direct driver) · 76–100 = central — crossing 75 marks the domain as compounding, and two or more above 75 raises κ.

Worked examples:

Black maternal & infant mortality — D3 Health 90 · D8 Equity 85 · D1 Economic 60 · D7 Cohesion 55 · others 25–40. Health and equity compound (κ rises); economic and social context contribute.

Childhood lead exposure — D6 Environment 90 · D2 Housing 85 · D8 Equity 80 · D3 Health 65 · others 20–40. Three domains cross 75: the issue is structurally compounded.

Eviction crisis — D2 Housing 95 · D1 Economic 85 · D8 Equity 70 · D5 Safety 45 · others 20–35.

Rural senior isolation — D7 Cohesion 90 · D3 Health 75 · D4 Education/broadband 70 · D1 Economic 50 · others 20–30.

Youth justice involvement — D5 Safety 90 · D4 Education 80 · D1 Economic 70 · D8 Equity 70 · others 25–40.

The rule that matters most: set the weights with the community carrying the burden, not for them — community knowledge enters the math here, and the Phase 1 co-design gate holds pathways provisional until it does.

D1 · Economic Security & Povertypoverty · income · SNAP · housing cost burden
50
D2 · Housing Stability & Qualityeviction · overcrowding · substandard housing
50
D3 · Health Access & Outcomesuninsured · life expectancy · infant mortality
50
D4 · Education & Opportunitygraduation · reading proficiency · childcare access
50
D5 · Safety & Violenceviolent crime · domestic violence · incarceration
50
D6 · Environmental Conditionsair quality · lead exposure · toxic site proximity
50
D7 · Social Capital & Cohesioncivic participation · nonprofit density · trust
50
D8 · Racial & Structural Equitysegregation · racial income gap · disparate impact
50
Compounding · κ
1.00

Move the sliders. When two or more domains exceed the 75th-percentile threshold, κ rises above 1 — quantifying how intersecting burdens compound into harm greater than their sum.

Step 4 of 4 · Forge the pathways

iRISE™ generates a ranked solution set. The SIEP escalation rule forces meso- and macro-level pathways when burden is high — so the solution matches the scale of the problem.

Opens a print-ready report: your problem statement, intersections, domain weights, κ, the highest-burden counties on your weights (with live data), and ranked micro/meso/macro solution pathways with APA citations.

Six states, six intersectional questions

Each case shows the Forge at work: the intersectional question it prompts you to answer, the single-axis response a community would usually be handed, and the alternative the Forge generates once the question is answered honestly. The questions are the engine — they force the analysis past one wound at a time toward the compounding cause.

WISCONSIN · BLACK INCARCERATION DISPARITY

The Forge asks: “Who, specifically, carries this burden — and which systems intersect at that point?”

SINGLE-AXIS ANSWER

Fund individual re-entry programs — job training and counseling after release.

FORGE ALTERNATIVE

Naming race × place × class × family × health (1 in 36 Black Wisconsinites incarcerated) surfaces that re-entry alone never reaches the cause. The Forge escalates to parole-revocation reform and racial-impact statements on sentencing — structural levers, with re-entry as one tier, not the whole plan.

CALIFORNIA · HOMELESSNESS & THE RACIAL HOUSING GAP

The Forge asks: “What does a voucher fail to fix once race, age, and disability are layered in?”

SINGLE-AXIS ANSWER

Issue more housing vouchers and build shelter capacity.

FORGE ALTERNATIVE

Naming race × wealth × age × disability × immigration (Black Californians 5× overrepresented) shows vouchers stall on the wealth gap and landlord rejection. The Forge targets voucher usability, source-of-income protections, and the wealth gap — reaching aging Black renters specifically, not an undifferentiated “homeless” average.

MICHIGAN · BLACK MATERNAL & INFANT MORTALITY

The Forge asks: “Is the gap an average to lower, or a ratio between groups to close?”

SINGLE-AXIS ANSWER

Expand prenatal-care access and improve clinic outreach.

FORGE ALTERNATIVE

Naming race × gender × place × food × clinical bias (Black infant mortality 3×+ the white rate) reframes the goal. The Forge encodes “weathering” as a measurable variable and audits to close the racial ratio — doula coverage, bias accountability, and food access — not just nudge the statewide average.

OHIO · INFANT MORTALITY + THE OVERDOSE CRISIS

The Forge asks: “Are two crises being treated separately that are actually one compounding pair?”

SINGLE-AXIS ANSWER

Run a maternal-health program and a separate opioid-response program.

FORGE ALTERNATIVE

Naming race × maternal status × SUD × geography surfaces the SUD × infant-mortality compounding pair that two siloed programs each miss. The Forge generates integrated maternal–SUD treatment — one pathway for the people living at both crises at once.

NEW YORK · THE EVICTION & HOUSING-INSECURITY CRISIS

The Forge asks: “Within this crisis, which stratum is hit sharpest — and is the remedy built for them?”

SINGLE-AXIS ANSWER

Expand rental-assistance funds for tenants behind on rent.

FORGE ALTERNATIVE

Naming race × gender × disability × language × family (~200K eviction filings in 2022, hitting Black women hardest) sharpens the remedy. The Forge prioritizes right-to-counsel and voucher alignment for the sharpest stratum — assistance funds alone leave that group exposed.

ARIZONA · CHILDREN’S PANDEMIC LEARNING & MENTAL-HEALTH LOSS

The Forge asks: “Whose children absorbed the pandemic’s losses — and which systems converged on them at once?”

SINGLE-AXIS ANSWER

Fund after-school tutoring and academic catch-up to recover lost learning.

FORGE ALTERNATIVE

Naming race × class × place × language × broadband shows the loss landed hardest on low-income Latino and Native children — where remote learning collided with the digital divide, caregiver job loss, family COVID deaths, and a child mental-health system already stretched thin. Tutoring alone treats one symptom. The Forge escalates to school-based mental-health services, tribal and bilingual family support, and closing the home-broadband gap — reaching the children who carried the heaviest, most compounded burden rather than the average student.

Citations

The iRISE™ method and this Forge are grounded in the peer-reviewed intersectionality literature. The sources below inform the compounding coefficient, the multilevel escalation path, and the fairness audit. References are APA 7th edition; all retrieved June 2026. These same citations appear in every brief the Forge generates.

1  Crenshaw, K. W. (1989). Demarginalizing the intersection of race and sex: A Black feminist critique of antidiscrimination doctrine, feminist theory and antiracist politics. University of Chicago Legal Forum, 1989(1), 139–167.

GROUNDS: IDENTITY-FIRST ANALYSIS · THE NON-ADDITIVE κ COEFFICIENT

2  Crenshaw, K. W. (1991). Mapping the margins: Intersectionality, identity politics, and violence against women of color. Stanford Law Review, 43(6), 1241–1299.

GROUNDS: STRUCTURAL, POLITICAL & REPRESENTATIONAL INTERSECTIONALITY

3  Collins, P. H. (2000). Black feminist thought: Knowledge, consciousness, and the politics of empowerment (2nd ed.). Routledge.

GROUNDS: MATRIX OF DOMINATION · THE STRUCTURAL-SYSTEMS CHECKLIST

4  Collins, P. H. (2019). Intersectionality as critical social theory. Duke University Press.

GROUNDS: CRITICAL PRAXIS · COMMUNITY CO-DESIGN MANDATE

5  Collins, P. H., & Bilge, S. (2020). Intersectionality (2nd ed.). Polity Press.

GROUNDS: FOUR DOMAINS OF POWER · REPRESENTATIONAL CONTEXT

6  Faraji, Z., et al. (2021). Applying intersectionality in designing and implementing health interventions: A scoping review. BMC Public Health, 21, 1407.

GROUNDS: THE SIEP MULTILEVEL ESCALATION PATH · REFLEXIVITY

7  Tinner, L., Holman, D., Ejegi-Memeh, S., & Laverty, A. A. (2023). Use of intersectionality theory in interventional health research in high-income countries: A scoping review. IJERPH, 20(14), 6370.

GROUNDS: WHY SINGLE-AXIS INTERVENTIONS WORSEN INEQUITIES

8  Guilamo-Ramos, V., et al. (2024). Application of a heuristic framework for multilevel interventions to eliminate the impact of unjust social processes and harmful SDOH. Prevention Science.

GROUNDS: MULTILEVEL FRAMEWORK · COMMUNITY RESILIENCE MODIFIER

9  Simkus, A., Holtz, K. D., & Twombly, E. C. (2024). An intersectionality framework for identifying relevant covariates in health equity research. Frontiers in Public Health, 12, 1286121.

GROUNDS: PHASE 0 COVARIATE IDENTIFICATION · ADDITIVE VS. INTERACTION

10  Wang, A., Ramaswamy, V. V., & Russakovsky, O. (2022). Towards intersectionality in machine learning. FAccT ’22.

GROUNDS: HANDLING SMALL INTERSECTIONAL SUBGROUPS · DISAGGREGATED AUDIT

11  Himmelreich, J., Hsu, A., Veomett, E., & Lum, K. (2024). The intersectionality problem for algorithmic fairness. PMLR, 279, 68–95.

GROUNDS: THE PHASE VIII INTERSECTIONAL FAIRNESS AUDIT

12  Robertson, S., Magee, L., & Soldatić, K. (2022). Intersectional inquiry, on the ground and in the algorithm. Qualitative Inquiry, 28(7), 814–826.

GROUNDS: PAIRING COMMUNITY KNOWLEDGE WITH COMPUTATIONAL METHOD

13  Park, S. Y., & Berkowitz, S. (2025). The intersectionality of social determinants and mental health outcomes. PMC 12110030.

GROUNDS: SDOH COMPOUNDING · BURDEN-WEIGHTING IN PHASE II

Copyright & intellectual property

© 2026 Dr. Crystallee Crain and Prevention at the Intersections. All Rights Reserved. The iRISE™ algorithm — its formula set, tensor architecture, variable definitions, nine-phase structure, compounding-coefficient logic, structural-escalation path, and fairness-audit method — together with this Solution Forge, the Michigan Prevention Data Atlas, and their documentation, are original works authored by Dr. Crystallee Crain. They are protected under the U.S. Copyright Act (17 U.S.C. §§ 101 et seq.), common-law trade-secret protection, and a pending patent application covering the computational method for intersectional intervention-pathway resolution.

Mark claimed by Prevention at the Intersections: iRISE™

The Forge runs entirely in your browser — nothing you enter is transmitted or stored — and it supports, but does not replace, community knowledge and human judgment.  Open the live Forge at midataatlas.org →